Understanding topographic maps requires a firm grasp of the topographic map contour interval. A USGS map, for instance, utilizes the contour interval to represent elevation changes, an essential element for activities like hiking. The contour interval attribute directly affects terrain analysis using Geographic Information Systems (GIS). Therefore, mastering topographic map contour interval enables more accurate interpretations of landscape features.
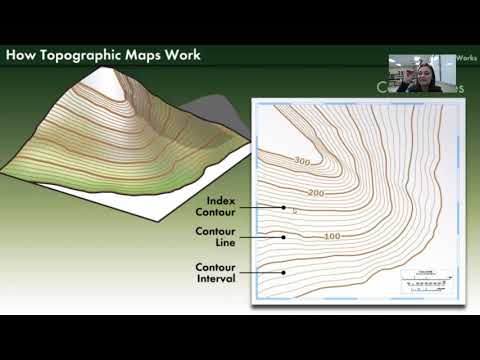
Image taken from the YouTube channel Sydney Selman , from the video titled Topographic Maps, Contour Lines, and Contour Intervals .
Understanding Topographic Map Contour Intervals
Topographic maps are powerful tools for representing the three-dimensional shape of the Earth’s surface on a two-dimensional plane. One of the most crucial elements for interpreting these maps is the topographic map contour interval. This explanation breaks down what it is, why it matters, and how to use it effectively.
What is a Contour Interval?
The contour interval is the vertical distance between adjacent contour lines on a topographic map. Contour lines connect points of equal elevation above a reference point, usually mean sea level. Therefore, the contour interval tells you the amount of elevation change represented by each line.
Visualizing the Contour Interval
Imagine slicing a hill horizontally at regular intervals. Each slice represents a specific elevation, and the edge of each slice is a contour line. The distance between these slices is the contour interval.
- Example: If the contour interval is 20 feet, each contour line represents a change of 20 feet in elevation compared to the next line.
Significance of the Contour Interval
The contour interval is not a fixed value and is carefully chosen by the mapmaker based on several factors. It significantly impacts the level of detail a map can show and influences its overall readability.
Factors Influencing Contour Interval Selection:
- Terrain: Flat or gently sloping areas require smaller contour intervals to depict subtle changes in elevation. Mountainous regions may use larger intervals for clarity.
- Map Scale: The scale of the map (the ratio between distance on the map and distance on the ground) affects the appropriate contour interval. Smaller-scale maps generally use larger intervals.
- Purpose of the Map: Maps designed for detailed engineering projects might use smaller contour intervals than maps intended for general navigation.
Common Contour Intervals
While any interval is possible, some common examples include:
- 10 feet
- 20 feet
- 40 feet
- 100 feet
Finding the Contour Interval on a Map
The contour interval is usually clearly stated on the map legend or within the map margins. Look for a statement such as "Contour Interval = 40 Feet."
Index Contours
To aid in reading the map, every fifth contour line is usually an index contour. Index contours are thicker and often labeled with their elevation value. This makes it easier to quickly determine the elevation of a particular area and to count the number of contour lines between index contours.
Interpreting Contour Intervals
Understanding how to interpret contour lines and their interval is essential for visualizing the terrain.
Slope Analysis
The spacing of contour lines indicates the steepness of the slope:
- Closely spaced contour lines: Indicate a steep slope. A given horizontal distance covers a large change in elevation.
- Widely spaced contour lines: Indicate a gentle slope. A given horizontal distance covers a small change in elevation.
- Uniformly spaced contour lines: Indicate a uniform slope.
Identifying Terrain Features
Contour lines can reveal various terrain features:
- Hills: Represented by closed, concentric contour lines. The elevation increases towards the center.
- Depressions: Represented by closed, concentric contour lines with hachure marks (short lines pointing inwards). The elevation decreases towards the center.
- Valleys: Represented by contour lines that form a "V" shape, with the point of the "V" pointing upstream (towards higher elevation).
- Ridges: Represented by contour lines that form a "V" shape, with the point of the "V" pointing downstream (towards lower elevation).
Calculating Elevation
By using the contour interval and the index contours, you can determine the elevation of any point on the map. Simply count the number of contour lines above or below a known elevation (index contour) and multiply by the contour interval.
Practical Applications
Understanding contour intervals is crucial for numerous applications:
- Navigation and Hiking: Planning routes, assessing slope difficulty, and estimating elevation gains.
- Engineering and Construction: Site planning, determining cut and fill volumes, and assessing slope stability.
- Environmental Studies: Watershed delineation, flood plain mapping, and erosion analysis.
- Geographic Information Systems (GIS): Creating digital elevation models (DEMs) and performing spatial analysis.
FAQs: Understanding Contour Intervals on Topographic Maps
Here are some frequently asked questions about contour intervals and how they’re used to interpret topographic maps.
What is a contour interval on a topographic map?
The contour interval on a topographic map represents the vertical distance between adjacent contour lines. It’s the constant difference in elevation between each line, showing how much the elevation changes. This is a key indicator for determining the steepness and shape of the terrain.
How does the contour interval affect the appearance of slopes on a topographic map?
A smaller contour interval indicates gentler slopes because the elevation changes gradually. Conversely, a larger contour interval shows steeper slopes as the elevation changes rapidly over the same horizontal distance. Tightly spaced lines mean steep slopes, and widely spaced lines mean gentle slopes.
Where can I find the contour interval value on a topographic map?
The contour interval is typically indicated in the map’s legend or marginal information. Look for a statement like "Contour Interval = 40 feet" which means each contour line represents a 40-foot change in elevation from the adjacent lines.
Why is understanding the topographic map contour interval important?
Understanding the contour interval allows you to accurately visualize the terrain represented on the map. This is essential for planning hikes, assessing terrain suitability for construction, or any activity that requires knowledge of elevation changes. Without understanding the interval, you cannot properly interpret the map.
So there you have it – the lowdown on topographic map contour interval! Hopefully, you’re now equipped to tackle those maps with confidence. Happy exploring!