The field of statistical hypothesis testing relies heavily on two crucial measures: the z score and p value. Understanding these measures allows researchers and analysts to determine the significance of their findings. The Central Limit Theorem, a foundational concept in statistics, provides the theoretical basis for calculating these values. Furthermore, applications like A/B testing commonly use the z score and p value to assess whether observed differences between variations are statistically meaningful. Many researchers at institutions like the National Institutes of Health (NIH) find that a clear grasp of the z score and p value is essential for rigorous data analysis and impactful scientific discovery.
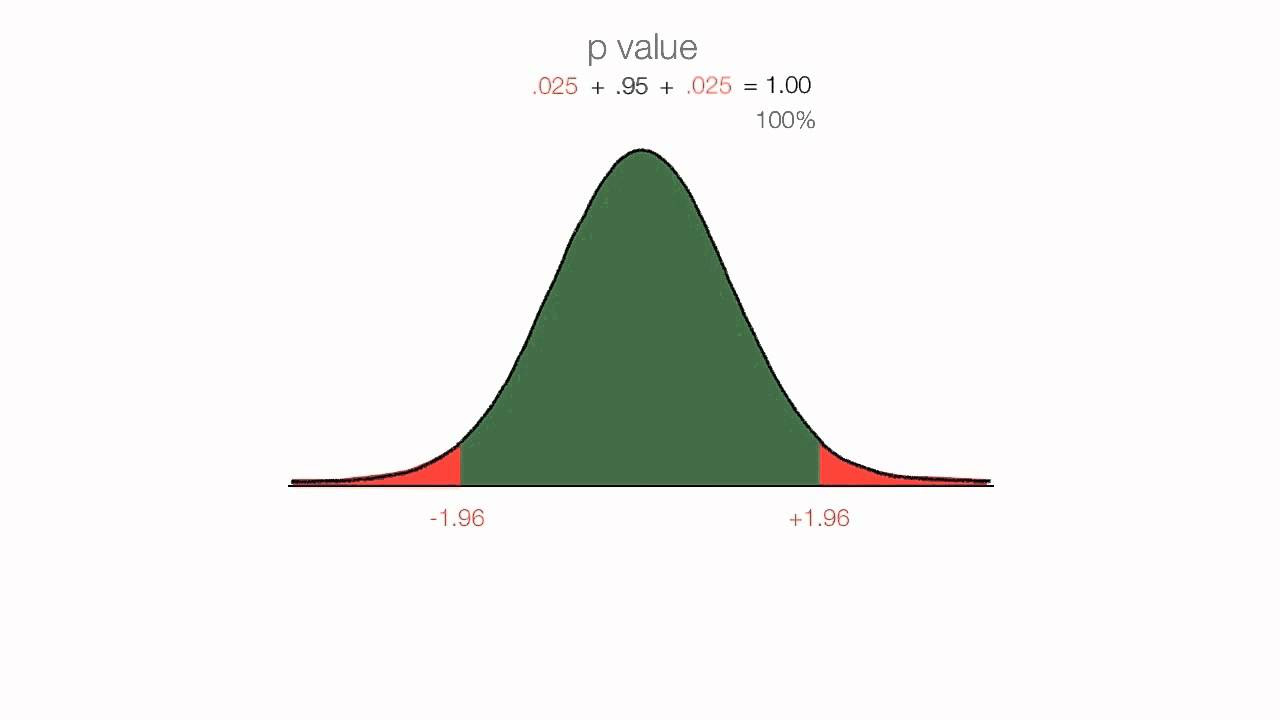
Image taken from the YouTube channel statisticsfun , from the video titled P Values, z Scores, Alpha, Critical Values .
Have you ever encountered a research paper filled with terms like "p < 0.05" or "Z = 2.5"? These seemingly cryptic symbols often represent the culmination of complex statistical analyses, designed to help us understand the world around us.
Yet, for many, these concepts remain shrouded in mystery, leading to confusion and even distrust of statistical findings. The Z-score and P-value, while powerful tools, are frequently misinterpreted or misunderstood, diminishing their true value in scientific inquiry.
Demystifying the Statistical Landscape
The Z-score and P-value are fundamental pillars of statistical analysis. They provide a framework for quantifying the likelihood of observed results and drawing meaningful conclusions from data.
Z-scores allow us to standardize data, enabling comparisons across different datasets and providing a measure of how far a particular data point deviates from the mean. P-values, on the other hand, help us assess the strength of evidence against a null hypothesis, guiding our decisions in hypothesis testing.
Understanding these concepts is not just for statisticians; it’s crucial for anyone who wants to critically evaluate information and make informed decisions based on evidence.
Thesis: Empowering Data-Driven Understanding
This article aims to demystify the Z-score and P-value, revealing their importance in hypothesis testing and providing a clear understanding of their applications. By breaking down the core principles and addressing common misconceptions, we will empower you to navigate the statistical landscape with confidence and interpret research findings with greater accuracy. We will equip you with the knowledge to move beyond superficial interpretations and appreciate the true power of these statistical tools.
Have you ever wondered how your height compares to the average person, or how your exam score stacks up against your classmates? The Z-score provides a standardized way to answer these questions, allowing you to understand where a single data point falls within a larger distribution.
Decoding the Z-Score: Measuring Distance from the Norm
At its core, the Z-score is a powerful tool for understanding data. It transforms raw data points into a standardized scale, allowing for easy comparison and interpretation. Let’s delve into the details of what a Z-score is and how it’s used.
What is a Z-Score?
A Z-score, also known as a standard score, quantifies the distance between a single data point and the mean of its dataset. This distance is measured in terms of standard deviations.
Think of it as a ruler that tells you how far away a particular value is from the average, using the standard deviation as the unit of measurement.
The primary purpose of a Z-score is to standardize data.
This standardization enables you to compare data points from different distributions or datasets that might have different scales and units. By converting everything to Z-scores, you can directly compare "apples to oranges."
The Z-Score Formula
The formula for calculating a Z-score is straightforward:
Z = (X – μ) / σ
Where:
- Z is the Z-score.
- X is the individual data point.
- μ (mu) is the mean of the dataset.
- σ (sigma) is the standard deviation of the dataset.
Breaking Down the Components
Let’s examine each component of the formula to understand its role:
- The Data Point (X): This is the specific value you want to standardize and compare.
- The Mean (μ): The average of all data points in the dataset. It represents the center of the distribution.
- The Standard Deviation (σ): A measure of the spread or variability of the data around the mean. A larger standard deviation indicates greater variability.
Interpreting Z-Scores
Once you’ve calculated a Z-score, understanding its value is crucial:
Positive vs. Negative Z-Scores
- A positive Z-score indicates that the data point is above the mean.
- A negative Z-score indicates that the data point is below the mean.
The further the Z-score is from zero, the further the data point is from the mean.
Z-Scores Close to Zero vs. Far From Zero
- A Z-score close to zero suggests that the data point is very close to the mean. It’s a typical or average value within the dataset.
- A Z-score far from zero (either positive or negative) indicates that the data point is an extreme value, significantly above or below the average.
For example, a Z-score of 2 indicates the data point is two standard deviations above the mean, while a Z-score of -1.5 indicates the data point is one and a half standard deviations below the mean.
Real-World Applications of Z-Scores
Z-scores are used across various fields.
In finance, they can assess the risk associated with an investment.
In healthcare, they can track a patient’s vital signs relative to normal ranges.
In education, they can compare student performance on standardized tests.
Imagine you’re comparing the heights of students in two different schools.
School A has an average height of 5’5" with a standard deviation of 3 inches, while School B has an average height of 5’7" with a standard deviation of 4 inches.
If a student in School A is 5’10", their Z-score would be (5’10" – 5’5") / 3" = 1.67.
If a student in School B is also 5’10", their Z-score would be (5’10" – 5’7") / 4" = 0.75.
This comparison shows that the 5’10" student in School A is relatively taller compared to their peers than the 5’10" student in School B.
Z-Scores and the Normal Distribution
The Z-score is intrinsically linked to the normal distribution (also known as the Gaussian distribution or bell curve).
In a normal distribution, approximately 68% of the data falls within one standard deviation of the mean (Z-scores between -1 and 1), 95% falls within two standard deviations (Z-scores between -2 and 2), and 99.7% falls within three standard deviations (Z-scores between -3 and 3).
This property of the normal distribution allows us to estimate the probability of observing a particular data point.
For instance, a Z-score of 2 is relatively rare, as only about 2.5% of the data is expected to be more than two standard deviations above the mean in a normal distribution.
By understanding the Z-score, you gain a valuable tool for interpreting data, comparing values across different datasets, and assessing the significance of individual data points within a distribution. Its applications span across various domains, making it an essential concept for anyone working with data analysis.
Have you ever wondered if a research finding is genuinely meaningful or just a fluke? The Z-score, as we’ve explored, helps standardize data, but it doesn’t tell the whole story. To truly assess the validity of a study’s conclusions, we need to understand the P-value, a concept that adds another layer of depth to statistical analysis.
Unveiling the P-Value: Probability and the Null Hypothesis
The P-value is a cornerstone of hypothesis testing, but it’s also a source of much confusion. Understanding what it really means—and what it doesn’t—is crucial for interpreting research findings and making informed decisions. Let’s unravel the intricacies of the P-value and its role in determining statistical significance.
What is a P-Value?
The P-value is the probability of obtaining results as extreme as, or more extreme than, the observed results, assuming the null hypothesis is true. It’s not the probability that the null hypothesis is true or false.
Think of it this way: the P-value quantifies the evidence against the null hypothesis. A small P-value suggests strong evidence against the null hypothesis, while a large P-value suggests weak evidence.
The P-value essentially answers the question: "If there’s truly no effect, how likely is it that I’d see data like this?"
The P-Value and Statistical Significance
The P-value is directly related to the concept of statistical significance. A result is considered statistically significant if the P-value falls below a predetermined threshold, known as the significance level (often denoted as alpha, α).
The Role of the P-Value in Hypothesis Testing
Hypothesis testing is a structured process for evaluating evidence and making decisions about a population based on a sample. The P-value is a key component of this process.
The general steps of hypothesis testing are:
- State the null and alternative hypotheses.
- Collect data and calculate a test statistic (which can be related to the Z-score).
- Calculate the P-value.
- Compare the P-value to the significance level.
- Make a decision: Reject or fail to reject the null hypothesis.
Understanding the Null and Alternative Hypotheses
The null hypothesis (H0) is a statement of no effect or no difference. It’s the hypothesis that researchers try to disprove. For example, "There is no difference in average test scores between students who use method A and those who use method B."
The alternative hypothesis (H1 or Ha) is the statement that researchers are trying to support. It contradicts the null hypothesis. For example, "There is a difference in average test scores between students who use method A and those who use method B."
The P-value helps determine whether there’s enough evidence to reject the null hypothesis in favor of the alternative hypothesis.
Significance Level: A Threshold for Decision-Making
The significance level (α) is the probability of rejecting the null hypothesis when it is actually true (Type I error). It’s a pre-set threshold that determines how much evidence is needed to declare a result statistically significant.
Common significance levels are 0.05 (5%), 0.01 (1%), and 0.10 (10%).
If the P-value is less than or equal to the significance level (P ≤ α), we reject the null hypothesis.
If the P-value is greater than the significance level (P > α), we fail to reject the null hypothesis.
Interpreting P-Values
The interpretation of P-values often causes confusion, so let’s clarify what small and large P-values actually imply.
What a Small P-Value Indicates
A small P-value (typically P ≤ 0.05) suggests that the observed data are unlikely to have occurred if the null hypothesis were true. Therefore, we have sufficient evidence to reject the null hypothesis.
This means that the effect or difference being investigated is likely real and not due to random chance. However, it doesn’t prove that the alternative hypothesis is true, only that there’s enough evidence to doubt the null hypothesis.
What a Large P-Value Implies
A large P-value (typically P > 0.05) suggests that the observed data are reasonably likely to have occurred even if the null hypothesis were true. Therefore, we fail to reject the null hypothesis.
This means that we don’t have enough evidence to conclude that the effect or difference being investigated is real. It doesn’t prove that the null hypothesis is true, only that we haven’t found sufficient evidence to reject it. The effect may exist, but the study may not have been powerful enough to detect it.
Common Misconceptions About P-Values
P-values are frequently misinterpreted, leading to flawed conclusions. It’s crucial to understand these limitations.
- Misconception 1: A small P-value proves that the alternative hypothesis is true.
- Reality: A small P-value only suggests evidence against the null hypothesis. It doesn’t prove the alternative hypothesis with absolute certainty.
- Misconception 2: A large P-value proves that the null hypothesis is true.
- Reality: A large P-value only means that we don’t have enough evidence to reject the null hypothesis. It doesn’t prove that the null hypothesis is true.
- Misconception 3: The P-value represents the probability that the results are due to chance.
- Reality: The P-value represents the probability of observing results as extreme as, or more extreme than, the observed results, assuming the null hypothesis is true.
- Misconception 4: Statistical significance implies practical significance.
- Reality: A statistically significant result may not be practically meaningful. A very small effect size can be statistically significant with a large enough sample size, but it may not have any real-world relevance. Always consider the effect size and the context of the study.
- Misconception 5: A P-value above 0.05 means there is no effect.
- Reality: It simply indicates that the study did not provide enough evidence to reject the null hypothesis.
Understanding the P-value and its limitations is essential for responsible data interpretation and decision-making. While the P-value is a valuable tool, it should always be considered in conjunction with other factors, such as effect size, study design, and prior knowledge.
Have you ever wondered if a research finding is genuinely meaningful or just a fluke? The Z-score, as we’ve explored, helps standardize data, but it doesn’t tell the whole story. To truly assess the validity of a study’s conclusions, we need to understand the P-value, a concept that adds another layer of depth to statistical analysis.
Z-Score and P-Value: A Symbiotic Relationship in Hypothesis Testing
The Z-score and P-value, while distinct statistical measures, are intrinsically linked within the framework of hypothesis testing. They work in tandem to provide a comprehensive assessment of research findings. Understanding their complementary roles is essential for drawing accurate conclusions from data.
The Interplay of Z-Scores and P-Values
The Z-score essentially tells you how many standard deviations away a particular data point is from the mean.
This distance is then used to calculate the P-value, which quantifies the probability of observing such an extreme result (or more extreme) if the null hypothesis were true.
In essence, the Z-score provides a standardized measure of the observed effect, while the P-value assesses the statistical significance of that effect.
Examples of Combined Use
Let’s consider a study investigating the effectiveness of a new drug designed to lower blood pressure. Researchers compare the blood pressure of patients taking the drug to a control group.
After analyzing the data, they calculate a Z-score that indicates a significant difference in blood pressure between the two groups.
The corresponding P-value, let’s say 0.02, indicates that there’s only a 2% chance of observing such a difference if the drug had no effect.
Based on a predetermined significance level (e.g., α = 0.05), the researchers would reject the null hypothesis and conclude that the drug is indeed effective in lowering blood pressure.
Another example: imagine testing whether a coin is fair.
After flipping it many times, you calculate a Z-score based on the number of heads.
If the P-value associated with that Z-score is high (e.g., > 0.05), you would fail to reject the null hypothesis.
This suggests that the observed number of heads is within the range of what you would expect from a fair coin.
Navigating Errors: Type I and Type II
The concepts of Type I and Type II errors are critical in hypothesis testing. They are directly influenced by the chosen significance level (α) and the resulting P-value.
A Type I error (false positive) occurs when we reject the null hypothesis when it is actually true. This happens when we find a statistically significant result (low P-value) simply by chance. The significance level (α) determines the probability of making a Type I error.
A Type II error (false negative) occurs when we fail to reject the null hypothesis when it is actually false. This often happens when the sample size is too small, or the effect size is too weak to detect.
The choice of significance level represents a trade-off between the risk of Type I and Type II errors.
A lower significance level (e.g., α = 0.01) reduces the risk of a false positive but increases the risk of a false negative.
Conversely, a higher significance level (e.g., α = 0.10) increases the risk of a false positive but reduces the risk of a false negative.
Have you ever wondered if a research finding is genuinely meaningful or just a fluke? The Z-score, as we’ve explored, helps standardize data, but it doesn’t tell the whole story. To truly assess the validity of a study’s conclusions, we need to understand the P-value, a concept that adds another layer of depth to statistical analysis.
Beyond the Basics: Applications and Implications
Statistical significance, as indicated by P-values, is a cornerstone of research across diverse fields. However, the true power of statistical analysis lies not just in calculating these values, but in understanding their context and limitations.
Let’s delve into the broader applications of Z-scores and P-values, examining their use across various disciplines, while also addressing the crucial need to consider effect size and practical significance alongside P-values.
Z-Scores and P-Values in the Real World
Z-scores and P-values aren’t confined to textbooks; they’re vital tools used by professionals across many sectors:
-
Medicine: In clinical trials, Z-scores and P-values help determine whether a new drug is significantly more effective than a placebo. Researchers can ascertain if observed improvements in patient outcomes are likely due to the drug itself, rather than random chance.
-
Finance: Financial analysts use Z-scores to assess the creditworthiness of companies. By evaluating financial ratios and calculating a Z-score, they can estimate the probability of bankruptcy.
P-values are used to test the efficiency of investment strategies.
-
Social Sciences: Sociologists and psychologists rely on these statistical measures to analyze survey data and experimental results. They can then determine whether observed differences between groups are statistically significant.
This could be when studying the impact of social programs or the effectiveness of therapeutic interventions.
-
Manufacturing/Quality Control: Z-scores are used in quality control to monitor production processes. They help identify deviations from established standards.
P-values can assess if any changes made to the production line improved the quality of a certain product.
The Pitfalls of P-Value Dependence
While P-values are essential, solely relying on them can be misleading. A statistically significant P-value (typically p < 0.05) indicates that the observed result is unlikely to have occurred by chance, if the null hypothesis is true. However, it doesn’t automatically imply that the result is important or meaningful in a practical sense.
Here’s why:
- Sample Size Matters: With very large sample sizes, even small and trivial effects can yield statistically significant P-values. This can lead to the false impression that an effect is important when it has minimal real-world relevance.
- P-Value does not equal effect size: A small P-value indicates that the result is unlikely to be due to random variation, but it doesn’t quantify the magnitude of the effect. A small P-value doesn’t make something important, it just makes it less likely due to chance alone.
Effect Size: Measuring the Magnitude of the Impact
Effect size measures the strength or magnitude of an effect. Unlike P-values, effect sizes are not influenced by sample size. Common measures of effect size include Cohen’s d (for comparing means) and Pearson’s r (for correlation).
Reporting effect sizes alongside P-values provides a more complete picture of the research findings. A statistically significant result with a large effect size is more likely to be practically meaningful than a significant result with a small effect size.
Practical Significance: Is it relevant in the real world?
Practical significance refers to the real-world importance or relevance of a finding. Even if a result is both statistically significant and has a substantial effect size, it may not be practically significant.
For example, a new teaching method might significantly improve student test scores (statistically significant) with a moderate effect size. However, if the improvement is only a few points on a test and requires a substantial investment of resources, it might not be considered practically significant.
The Role of Confidence Intervals
Confidence intervals provide a range of values within which the true population parameter is likely to fall. They offer a different, but complementary, perspective to P-values.
A narrow confidence interval indicates a more precise estimate of the true value, while a wide interval suggests greater uncertainty. If a confidence interval does not contain the null hypothesis value, the result is statistically significant.
Confidence intervals can be more informative than P-values. They provide an estimate of the effect size along with an indication of the precision of that estimate.
By considering the confidence interval, researchers and readers can better assess the range of plausible values for the effect and make more informed decisions.
In conclusion, while Z-scores and P-values are fundamental tools for statistical analysis, it’s crucial to interpret them within a broader context. Considering effect size, practical significance, and confidence intervals, allows for a more nuanced and meaningful understanding of research findings and their implications.
Z-Score & P-Value: Frequently Asked Questions
This FAQ section clarifies common questions about z-scores and p-values, as discussed in the main article, to help you better understand these statistical concepts.
What exactly is a z-score?
A z-score measures how many standard deviations a data point is away from the mean of its distribution. A positive z-score indicates the data point is above the mean, while a negative z-score indicates it’s below the mean.
How does a p-value relate to a z-score?
The p-value tells you the probability of observing a test statistic (like a z-score) as extreme as, or more extreme than, the one calculated, assuming the null hypothesis is true. A large z score corresponds to a small p value, suggesting stronger evidence against the null hypothesis.
What does a small p-value actually mean?
A small p-value (typically ≤ 0.05) suggests that the observed result is unlikely to have occurred by chance alone. This leads to rejecting the null hypothesis. Remember, a small p value associated with a z score indicates the sample mean is significantly different from the population mean.
Why are z-scores and p-values important?
Z-scores and p-values are fundamental statistical tools used to determine the significance of results in hypothesis testing. They help researchers and analysts make informed decisions based on data and decide whether to reject the null hypothesis. The z score allows for standardizing data for comparisons.
So, there you have it – a peek into the world of z score and p value! Hopefully, things are a bit clearer now. Keep exploring, keep questioning, and remember that statistics can be surprisingly insightful. Good luck!